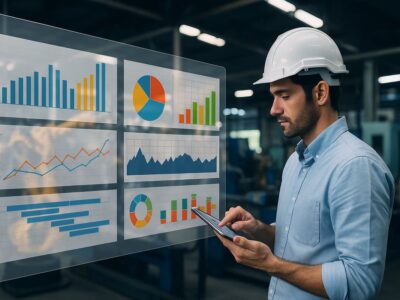
Mexican industry is experiencing an era where data visualization has become a strategic factor. The production plant is no longer just a place where products are manufactured, but the core of information generation. Every machine, every work shift, and every operator generates thousands of records that, when analyzed and correctly represented, can make the difference between a profitable operation and one with hidden losses.
In this context, manufacturing data visualization emerges as an essential tool for transforming large volumes of information into concrete, clear, and actionable decisions. Through interactive dashboards, dynamic charts, and visual displays , plant managers can anticipate problems, adjust production plans in real time, and ensure the achievement of strategic objectives.
What is manufacturing data visualization?
Data visualization involves graphically representing critical information from the production floor. This includes manufacturing data, inventory levels, energy consumption, machine downtime, operator performance, and more. The advantage of these tools is that they make information understandable at a glance, accelerating decision-making.
The concept of data visualization applied to industry is not new, but today, thanks to Big Data and advances in industrial automation, systems allow for the integration of multiple information sources into single dashboards that are updated in real time. This enables management to monitor global indicators, while operators can check the status of their work order or safety instructions at their workstation.
The importance of data on the production floor
The production floor is where small problems multiply. A machine downtime of even 10 minutes can create cumulative delays that affect daily production. A misallocation of materials increases production costs without management detecting it in time.
The key is to have visible and reliable production data. If an operator is 50% complete on their task but has already consumed 75% of the budgeted time, there is still time to adjust. This response would not be possible if the numbers were only reviewed at the end of the week.
Data monitoring enables a shift from a reactive to a predictive approach, enabling the ability to anticipate problems and maintain the stability of production systems.

Benefits of data visualization in manufacturing
Transparency and operational responsibility
When employees have access to their metrics, accountability and motivation increase. They can see how their efforts impact results and operator performance.
Improvement in communication
Digital control panels are replacing paper orders. Now, through an ERP system integrated with SCADA and MES systems , operators have instant access to instructions, documentation, and updates.
Real time control
Data can be filtered by employee, machine, department, or batch. The systems also allow for the display of Gantt charts or waterfall graphs that show the sequence of activities and the status of each order.
Costs reduction
With better traceability of materials, waste is reduced. This contributes to optimizing manufacturing systems and lowering production costs.
Customer satisfaction
The service department can check the status of any order in seconds and provide an accurate response, strengthening customer trust and loyalty.
Key technologies for manufacturing data visualization
AVEVA Historian: The Power of Operational Historians
Using operational historians like AVEVA Historian allows you to store and query large volumes of manufacturing data . Its advantages include:
- Real-time collection by IoT sensors.
- Integration with spreadsheets like Excel for non-technical users.
- Creation of interactive web boards.
- Manufacturing planning based on historical data and trends.
In Mexico, MES Automation has positioned itself as a certified integrator and expert in the implementation of AVEVA solutions , supporting manufacturing companies in maximizing the potential of their data. Thanks to its expertise, Mexican production plants can implement robust modernization strategies , optimize their processes, and make the leap to truly smart manufacturing with reliable, secure, and real-time information.
Data visualization and continuous improvement
The analysis doesn't end with data collection. Data visualization is the foundation of continuous improvement , as it transforms records into actionable knowledge. Data analysts and production managers use this information to identify trends, improve cycle times , and redesign processes to increase competitiveness.
One example is the use of visual management tools , which allow for the identification of bottlenecks or variations in performance. With this information, immediate adjustments are made to industrial processes , resulting in measurable increases in productivity.
Data visualization and Big Data in manufacturing
The arrival of Big Data has changed the way companies work with manufacturing data . Now, the volumes of information are so high that they require specialized data visualization systems to be interpreted.
Benefits include:
- Identifying hidden patterns in millions of records.
- Integration with Internet of Things and with the IoT sensors of the plant.
- Predictions by automatic learning y digital twins that simulate the behavior of a production line.
- Advanced analysis through platforms Business intelligence.
Towards the Connected Enterprise
The vision of a Connected Enterprise is for all levels of the organization to work with the same data, in real time, and without information silos. This entails:
- Integration of automated data systems with an intuitive human-machine interface.
- Connection between plant equipment and administrative areas through a centralized ERP system.
- Use of key performance indicators that transparently reflect the health of the operation.
In this way, the company not only visualizes but also precisely manages every aspect of its operations.
Use cases
- Energy optimization in paper and cardboard
A plant detected a 12% overuse of steam in ovens thanks to the data monitoring energetic. - Automotive
The Gantt charts showed recurring delays at the paint station. The adjustment reduced the cycle time total production by 8%. - Pharmaceutical
The digital twins They simulated temperature variations in reactors, improving regulatory compliance and reducing shutdowns.
The future of manufacturing data visualization in Mexico
The natural evolution of visualization involves the integration of artificial intelligence , predictive systems, and machine learning . With these technologies, plants will be able to anticipate quality defects, prevent equipment failures, and adapt manufacturing planning to high-demand scenarios.
The future will also be marked by:
- Connected Enterprise with unified information flows.
- Using treemaps to represent complex data hierarchies.
- Greater integration of production systems with advanced analytics tools.
USEFUL CONTENT – Digitize Manufacturing Procedures with AVEVA Work Tasks: Standardize and Improve
Conclusion
Manufacturing data visualization is much more than a pretty dashboard: it's the nerve center of decision-making in modern industry. By integrating Big Data, data visualization, ERP systems, operational historians, and industrial automation technologies, companies can achieve unprecedented levels of efficiency.
With strategies based on continuous improvement, modernization, and the Connected Enterprise, the industry is taking firm steps toward smart manufacturing. Digital twins, artificial intelligence, and the Internet of Things will be the next catalysts for this change.
In an increasingly competitive environment, companies that master data visualization and analytics will lead the future of manufacturing systems and achieve true operational excellence. Contact an advisor for more information.
Originally published on August 29, 2025, updated on September 1, 2025
 Industrial Process Mapping with AVEVA Work Task: Visibility that Drives Operational Excellence